Angels and Syndicates in VC: Market Share 2021–2024
Shares of funds, angel investors and syndicates among VC investors and deals in 2021–2024: global, US, and top and bottom countries, from Crunchbase data.
Originally published in MondayVC Newsletter, Edition 3, April 29, 2024, on LinkedIn. Figures are as of 2024.
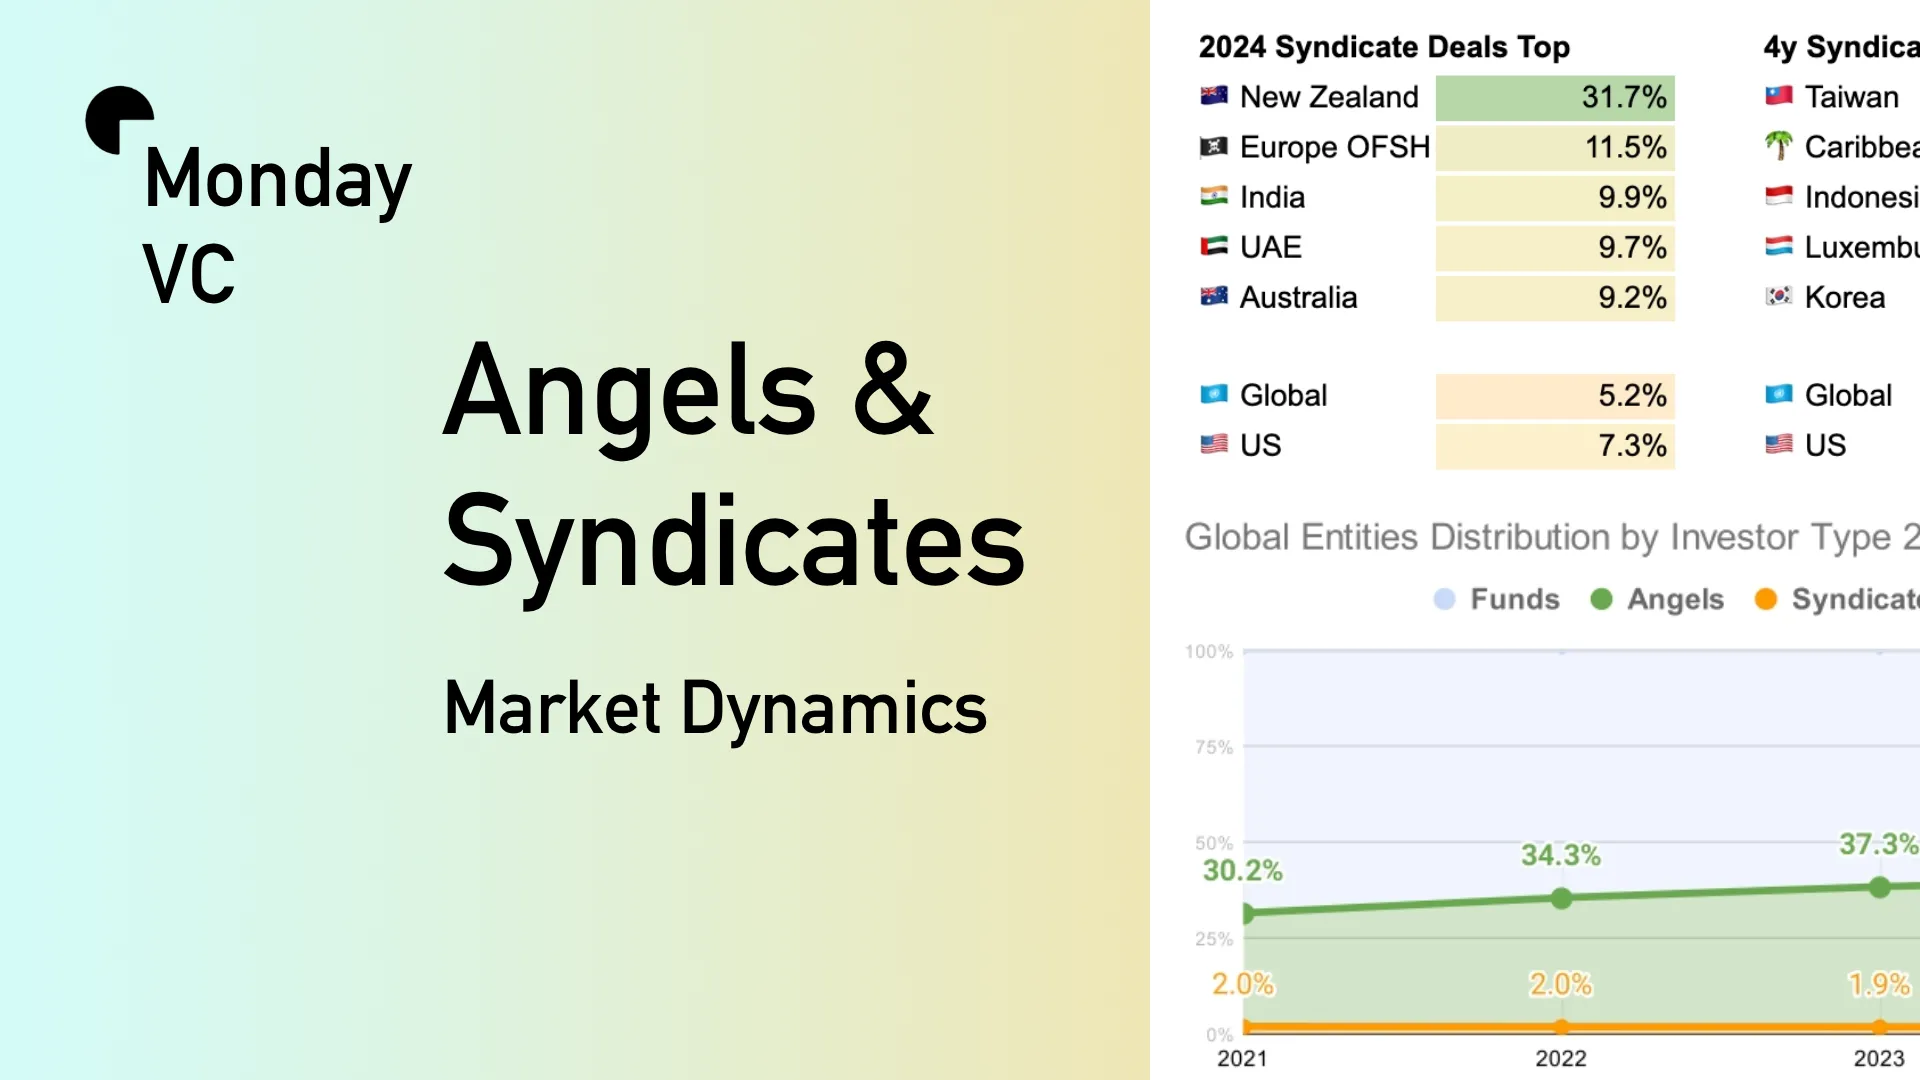
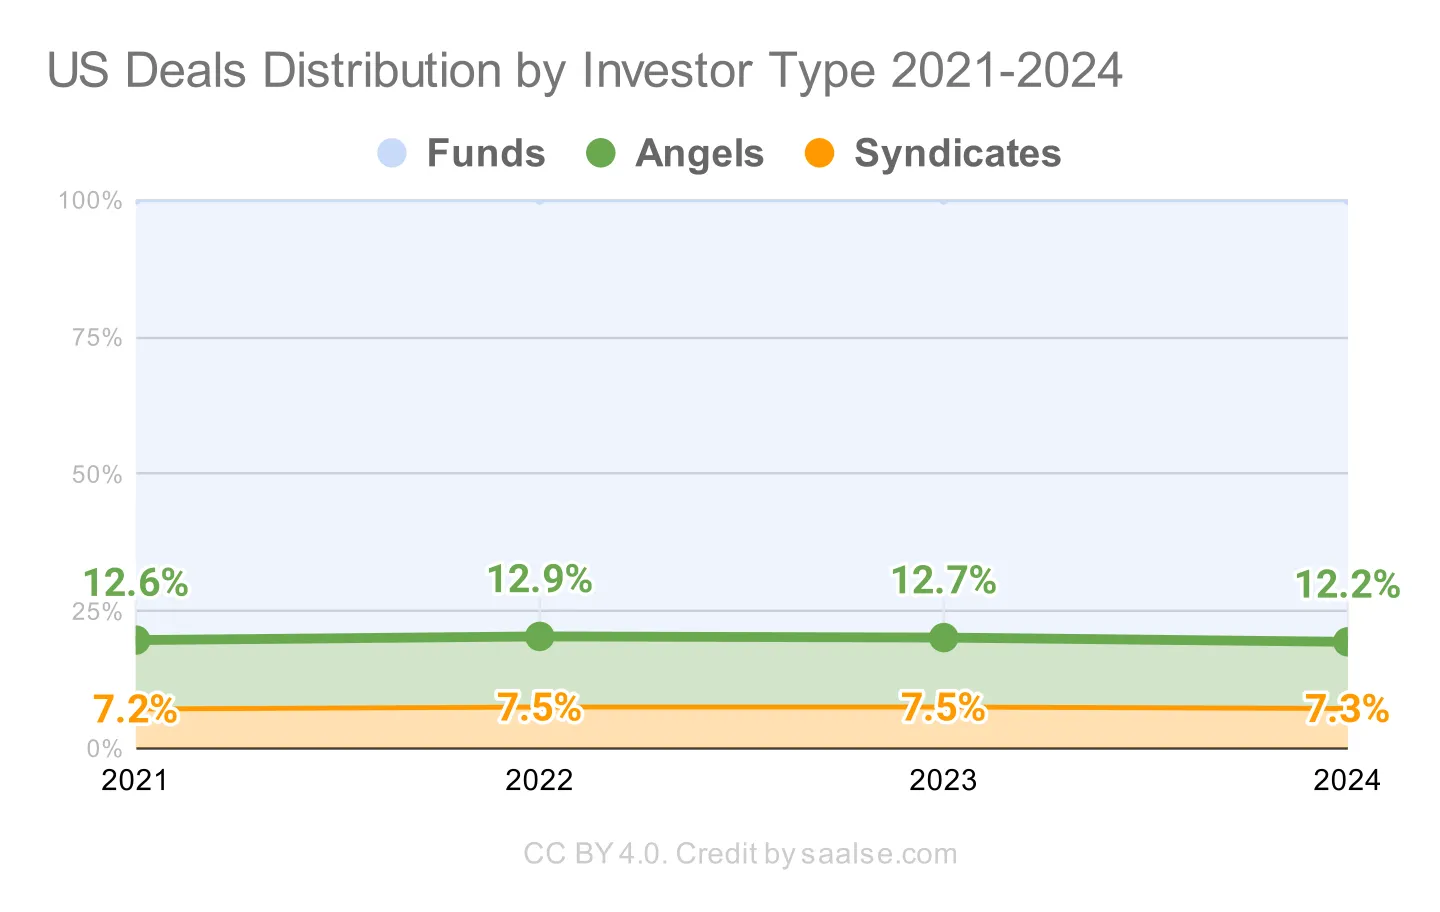
Key numbers: angels grew from 30.2% to 39.3% of VC investor entities worldwide in 2021–2024 but held at about 9% of deals; syndicates stayed near 2% of investors and 5% of deals. By country, New Zealand led syndicated rounds with 32%.
Today, I'm sharing a part of my ongoing research dedicated to the role of syndicates and angels in VC ecosystems at both global and local scales. You can find details on why this matters and the methodology at the end.
Disclaimer: This is non-fundamental research based on a small selection of data from one source. Read the Methodology for details.
Global and US Reference Points#
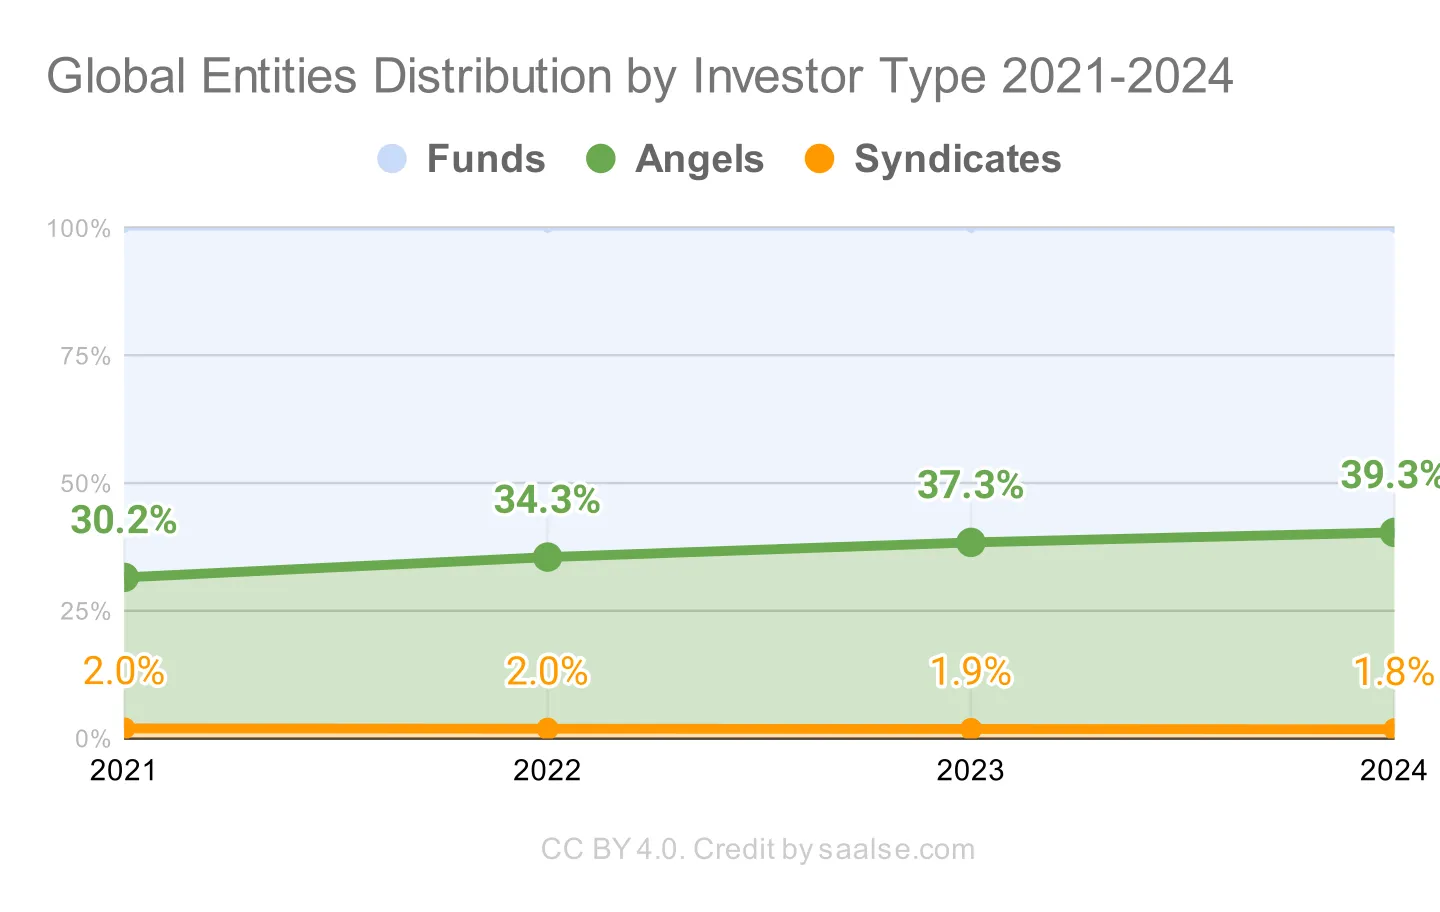
Funds dominate as a form but are slowly losing their share to individual angel investors. This indicates that globally, wealthy individuals are acting more often as direct investors rather than investing as Limited Partners in VC firms. This could mean that tech startups are becoming a more common investment target and that each year, exits generate new waves of wealthy individuals who were once founders and executives reinvesting their capital into the tech industry. Interestingly, the range of angels in specific countries varies from 2.7% to 54%. Guess which ones? Keep reading.
Angel groups and syndicates are very uncommon forms that are losing their popularity. However, in specific countries, the percentage ranges from 0.3% to 6%.
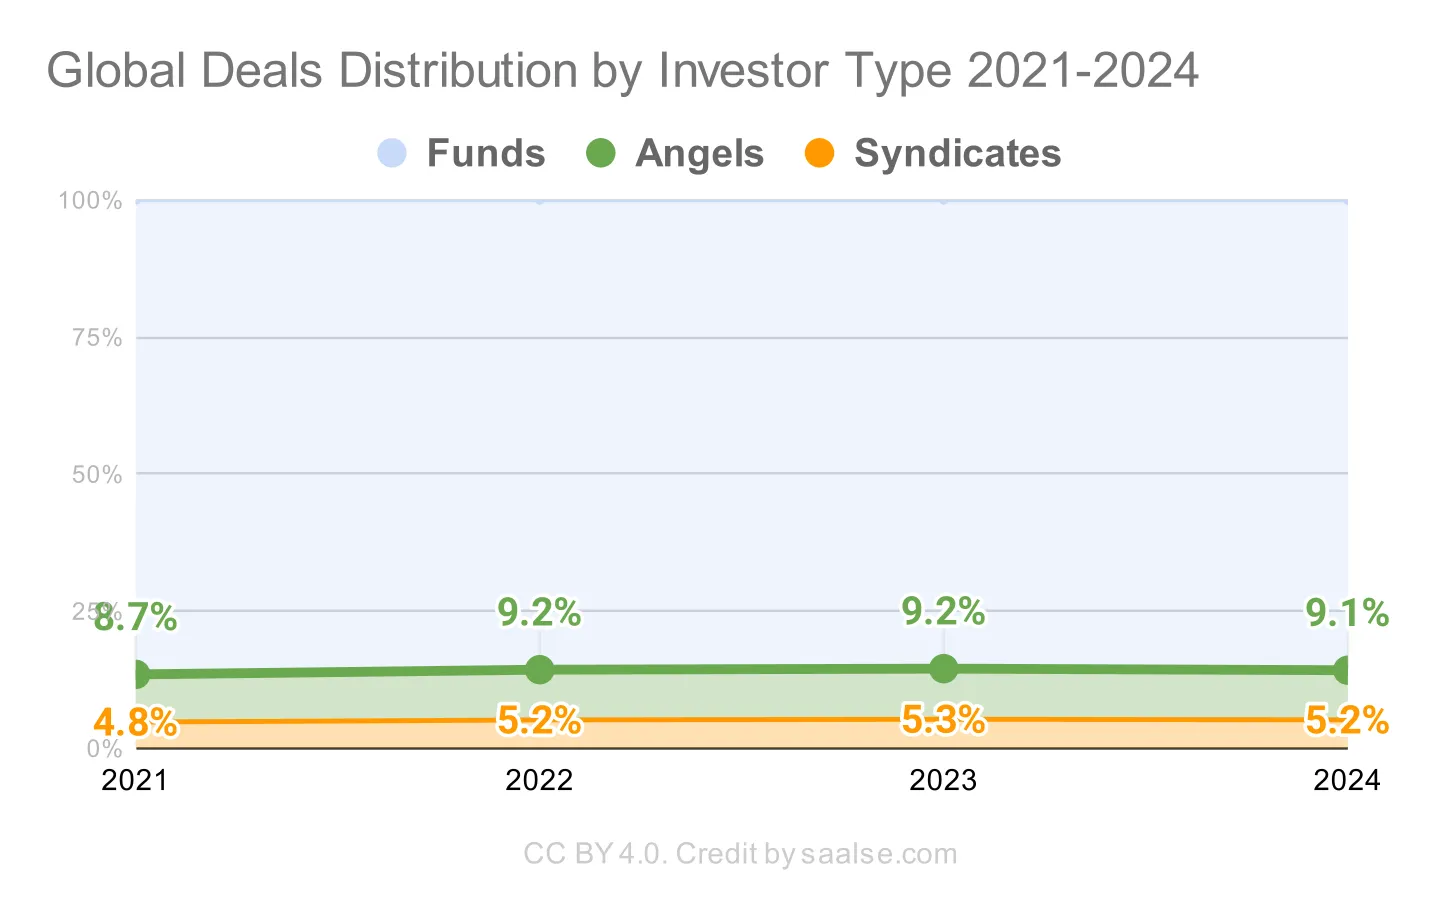
The number of deals by each investor type shows a different picture. Everything is stable on a global scale. Angel activity may remain stable even though the number of individuals cumulatively increases yearly; this could also be a sign of trial activity before becoming an LP or launching a fund. Alternatively, new angels might choose deals carefully and conduct fewer of them than professional firms. But again, it's spread around the globe, while specific countries show a 0.8% to 25% share of angel deals.
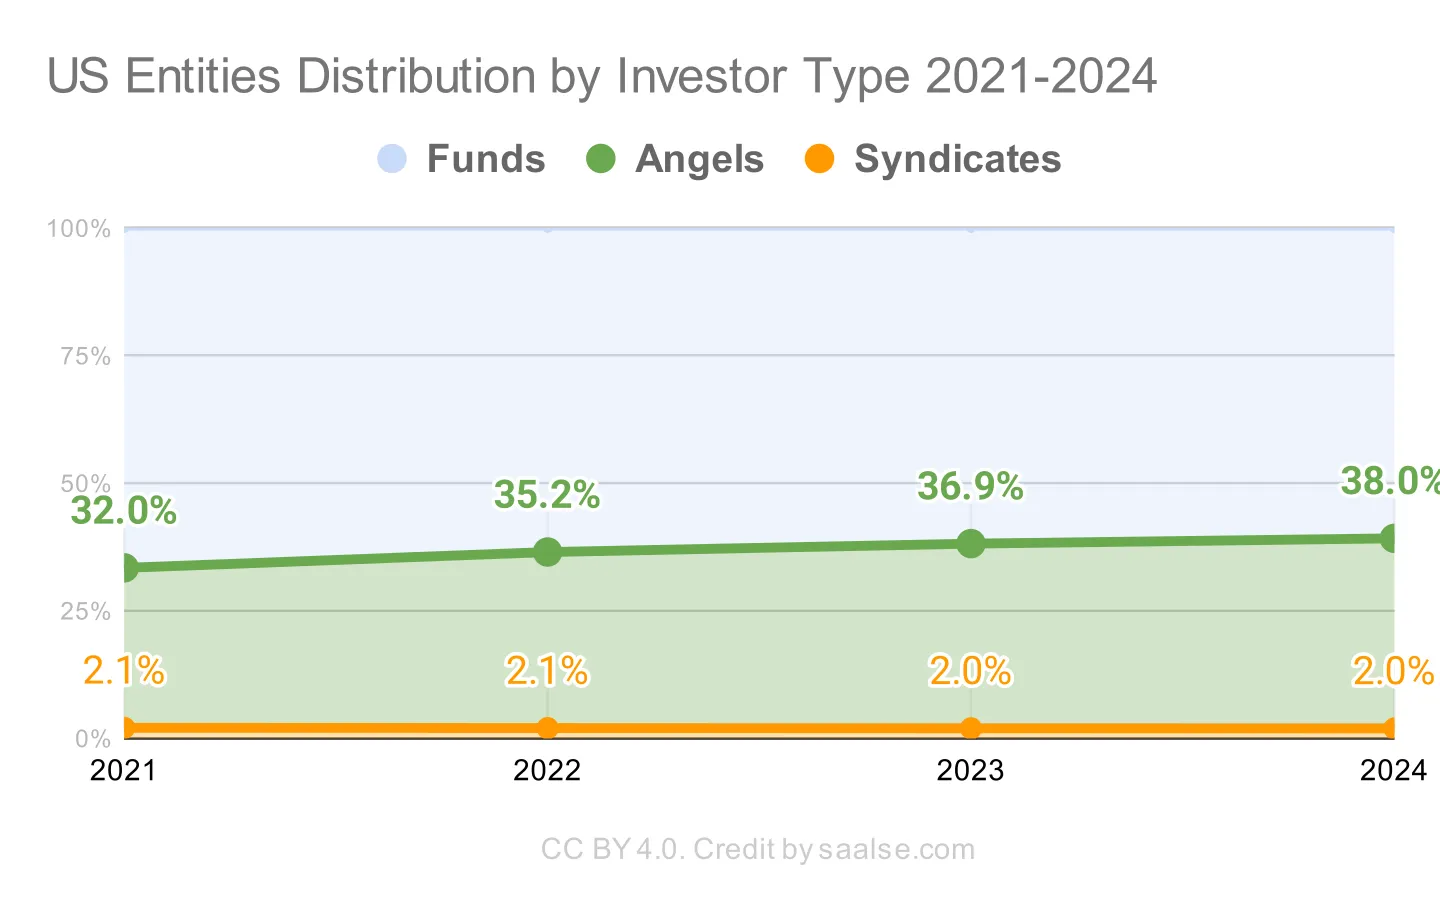
The United States, as the global industry leader, shows a similar picture in terms of investor-type distribution.
Being the most developed VC country, the US is above the global average in the number of deals by angels and syndicates but differs from the leader, which boasts 32% of syndicated investment rounds.
Outperformers and Outsiders#
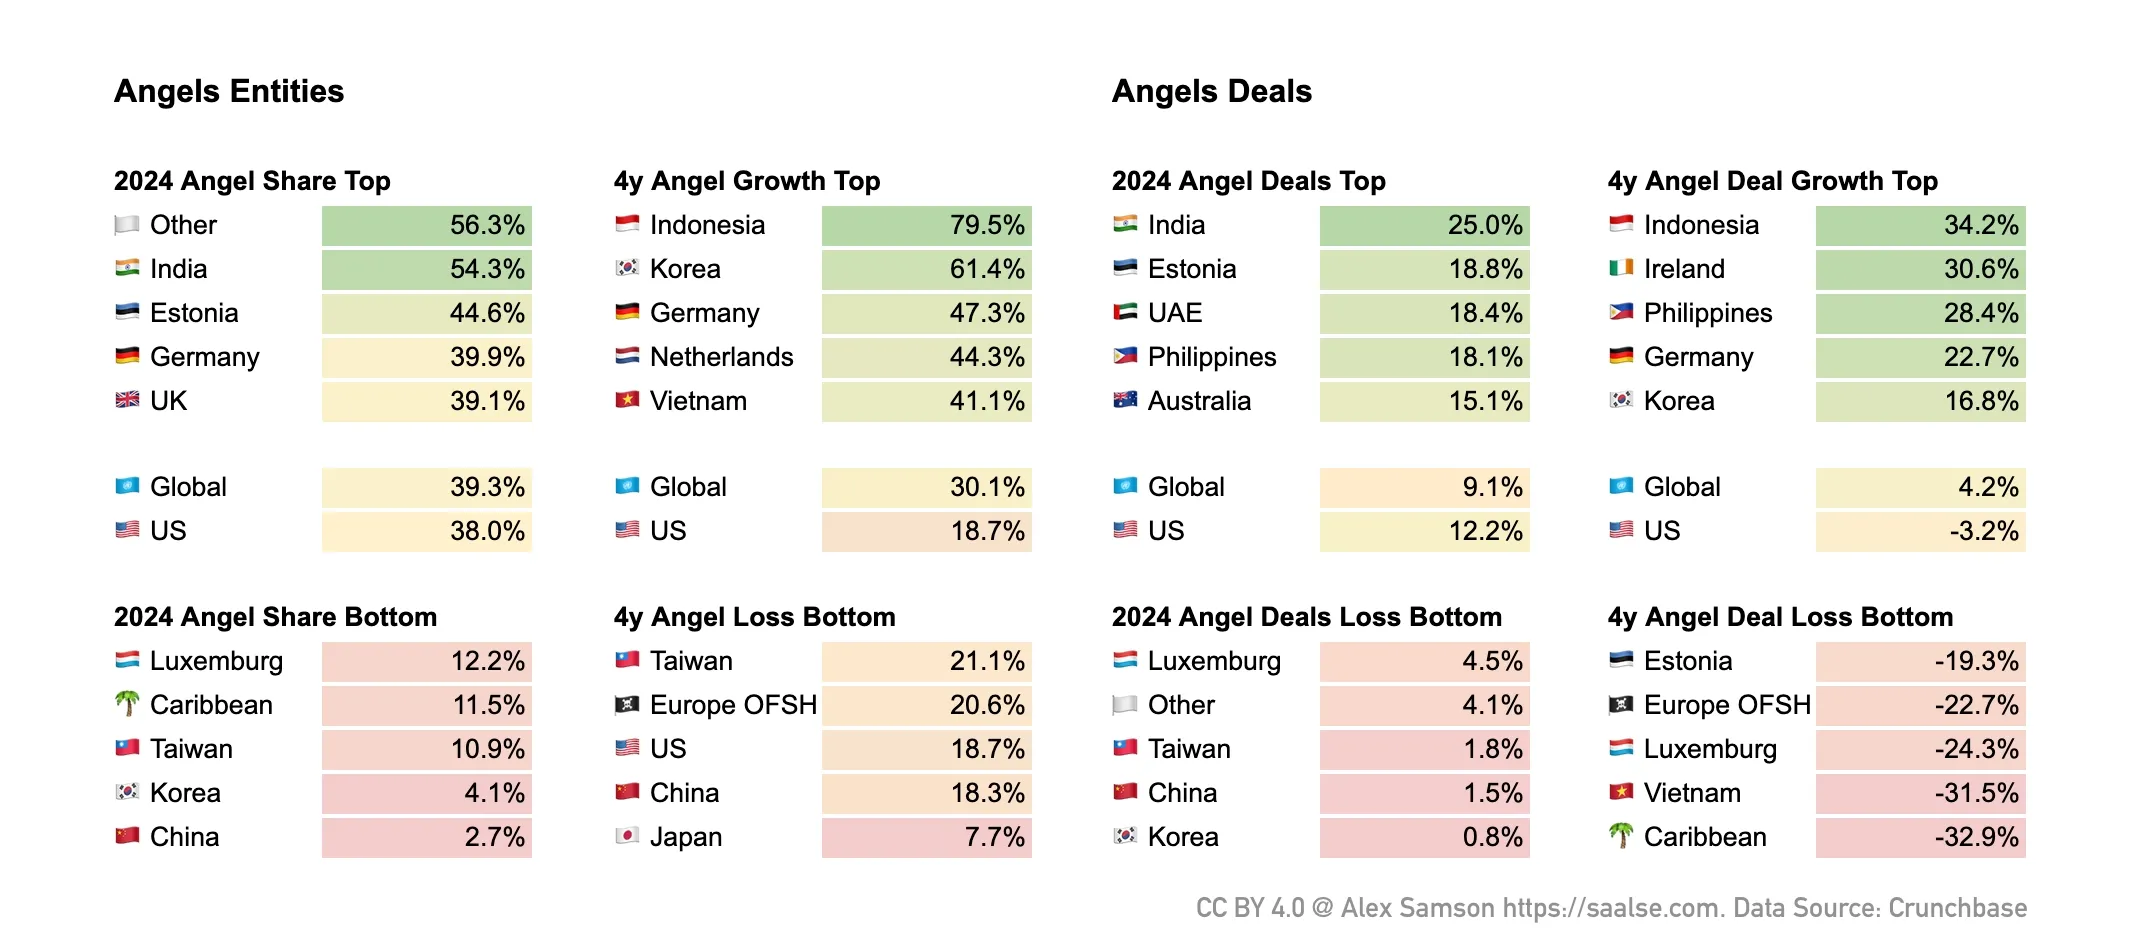
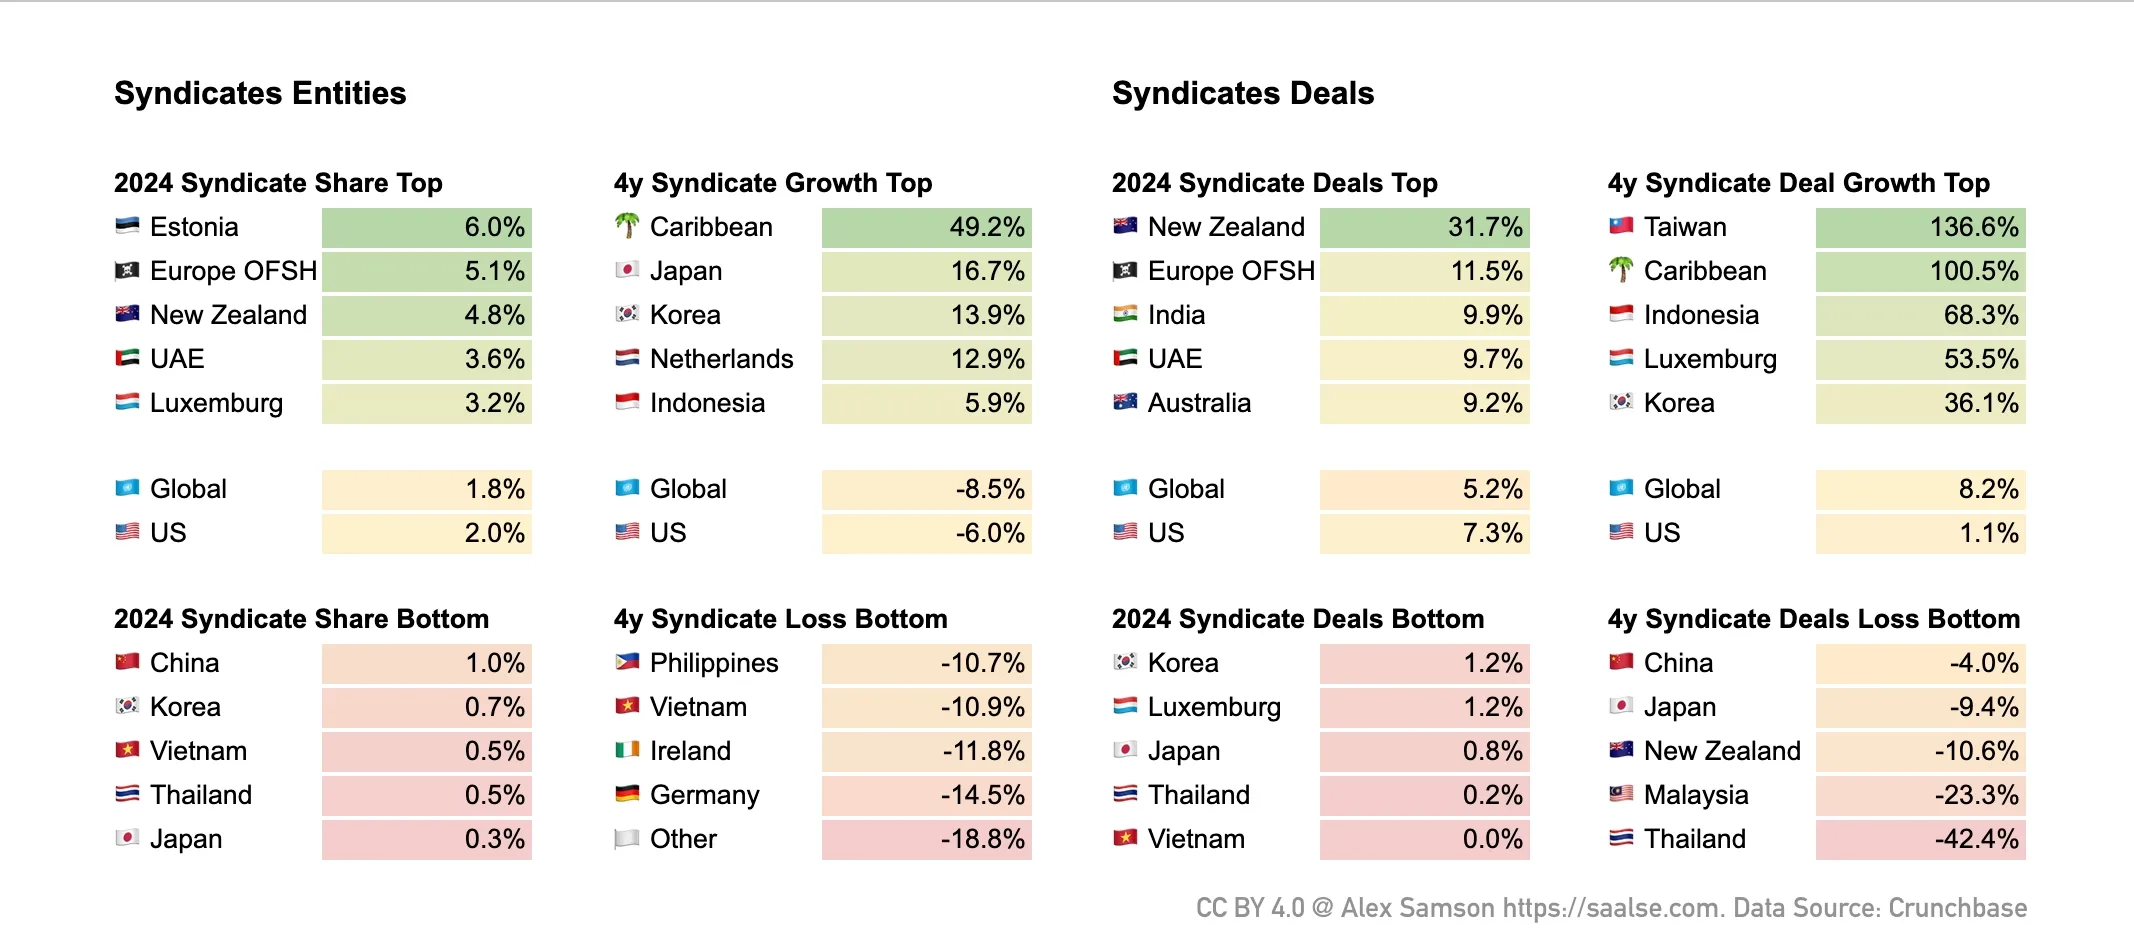
I explored the dynamics of syndicate entities and angel investors from 2021 to 2024, analyzing top and bottom countries in terms of syndicate shares, growth, and deal activity. This analysis offers insights into the global venture landscape, highlighting the increasing prominence of individual and group investors across various regions and pinpointing markets with rising or declining activity.
Each country's dynamics merit reflection and discussion with local experts.
I wish to leave space for readers to form their own insights, but just a few thoughts from me:
- China's VC ecosystem might be underrepresented in the data source. Alternatively, there could be a cultural tendency to act as organizations rather than individuals. Legal limitations on personal investments might also lead to investing through third-party jurisdictions.
- Indonesia and Korea demonstrate the effect of a low base in the number of angel investors, which has seen significant growth in recent years. This could be related to a wave of exits, creating a new generation of tech investors.
- The US, conversely, shows the effect of a high base, ceding ground to emerging VC countries in angel and syndicate growth.
- Syndicates seem to be an unfamiliar option in Asia, but trends indicate that Japan, Korea, and Indonesia are moving forward, adopting this form of investment.
Why does this matter?#
Jumping on the VC side as an emerging investor offers several options to start:
- 😎 Become an LP: To get a taste of the industry, engage in passive investing with your capital, ranging from $50K to $1M, in professional funds.
- 😇 Become an Angel: Invest your capital at a pace you desire, directly or collectively, as part of angel syndicates, with amounts from $10K to $500K. Use that traction to decide about the next steps.
- 😉 Launch a Syndicate: Try the VC manager role with full or part-time dedication, establish relationships with an investor network, and gain initial traction.
- 👌 Launch a Micro-VC, Venture Studio, or Accelerator: Raise less than $10M from your inner circle to test the waters and engage deeply, full-time or part-time.
- 💪 Launch a VC firm: Go full throttle and raise a $10–50M Fund 1 from LPs when you're already experienced in the industry with a track record of investments.
Over the last year, I've been viewing these options through different lenses to determine the strategy that best fits me. It becomes interesting to see the market dynamics across different forms of VC in recent years as I consider whether to proceed as a syndicate, angel, or fund.
Beyond the form, geography and industries are the most critical determining parameters. Read my post on Thesis Market-Fit for insights on choosing industries and geographies.
Another point about geography is the dynamics of the local venture ecosystem. As a digital nomad living in Bali, I'm looking at a global scale, and it was fascinating to explore dynamics in APAC, where I'm based now, and other world regions to assess whether local dynamics already outperform the average or might soon.
Methodology#
This research draws upon data from Crunchbase, complemented by comparisons to PitchBook and AngelList, to address known limitations in data completeness. Crunchbase figures are approximately 2 to 4 times lower than actuals. The analysis focuses on relative rather than absolute numbers over the last four years to capture the dynamics of venture capital activity.
The dataset encompasses 26 countries selected based on my current geography interests and popular startup HQs and tax jurisdictions. The selection includes the majority of countries from Northeast and Southeast Asia, alongside Australia, New Zealand, India from South Asia, the UAE from the Middle East, and the US from America. Selected European countries are also examined. Aggregated data representing Caribbean and European offshores.
The analysis centers on the count of investor entities and the volume of investment deals, providing a measure of business activity independent of capital flow. This approach mitigates the need to account for fluctuations in economic indicators such as local economy levels, inflation, and historical valuations, thus focusing on the activity levels of different investor types.
Previous in MondayVC Newsletter: Edition 2, Finding VC Co-Investors.
Next in MondayVC Newsletter: Edition 4, Check Size by Stage.