Fair Startup Valuations: Pre-Seed, Seed, Series A
Median US startup valuations in 2023 at pre-seed, seed and Series A from Carta, PitchBook and Aumni, checked against burn rate, CAC and exit values.
Originally published in MondayVC Newsletter, Edition 6, May 20, 2024, on LinkedIn. Updated October 31, 2026. Figures are as of 2024.
Key numbers: in 2023, reported median US post-money valuations were $6.3M–$8M at pre-seed, $15M–$18.9M at seed and $38.5M–$57M at Series A (PitchBook, Carta, Aumni). Median exit valuations were $111M for IPOs and $61M for M&As, so a $100M exit from a $44M Series A returns just 2.3x.
Startup valuations may appear speculative, influenced by market cycles and emotional sentiment. To anchor my investment strategy in quantitative analysis, I examined how today's benchmarked valuations align with potential exit, particularly for early-stage.
Startup Valuation Methods by Stage#
I liked the idea of weighted valuation methods by Equidam, a startup valuation provider:
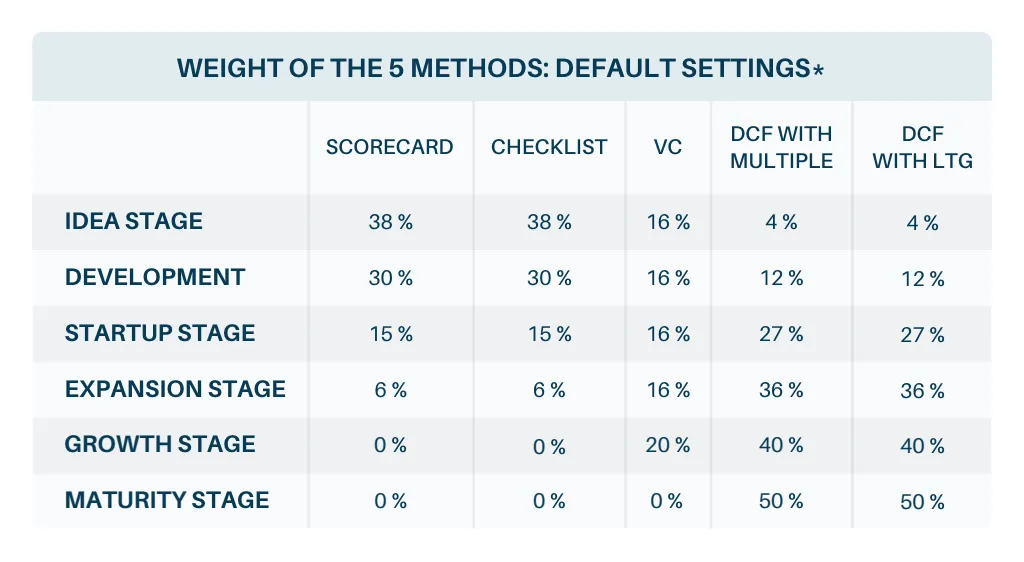
Scorecard and checklist methods for early stages use average and high startup valuation benchmarks for the target market when there is no or low revenue and risks are more related to the team, idea, and market. Discounted cash flow is used for late stages when there is validated PMF and revenue with YoY growth traction, with fewer unmanaged risks.
You can get detailed startup valuation methodology in PDF.
However, I have doubts about relying solely on benchmarks, which may be influenced by bubble cycles. Identifying momentum on that curve is essential to setting limits. I've kept this in mind and, due to its complexity, will pass for future consideration. Today, I will analyze different aspects of valuations.
Valuation Benchmarks: Carta, PitchBook, Aumni#
Many industry-leading providers offer quarterly and annual reports that detail actual valuations, accessible via databases that allow queries by specific industries, sub-sectors, and locations. However, each source has its unique nuances and limitations.
In my Lead & Follow Investors Check Sizes article, I used data from five providers to determine median round sizes. Using this, I reverse-engineered valuations based on median equity share and compared these figures to 2023 reports:
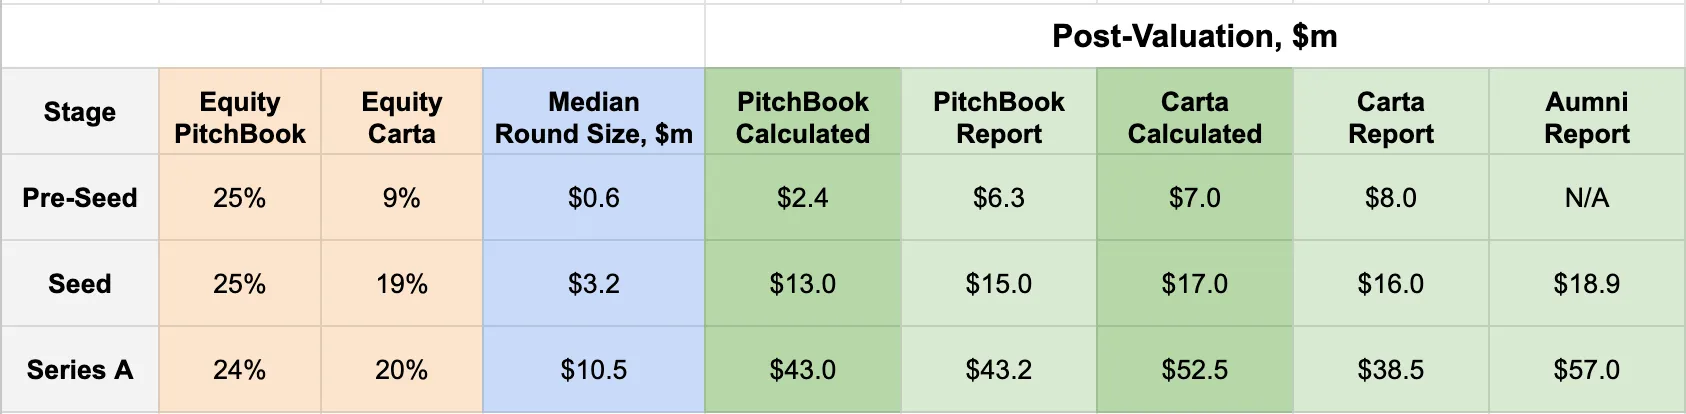
An interesting disparity emerges in the median percentage of equity between PitchBook and Carta. PitchBook's data suggest a fairer equity share, whereas Carta’s figures, which align more closely with stakes taken by Y Combinator, 500 Global, and Techstars, show valuations that are significantly lower.
Carta’s data show similar back-calculated and reported valuations for pre-seed and seed stages, but discrepancies arise at the Series A level. In contrast, Aumni’s reported valuations tend to be the highest, reflecting their unique data access.
This diversity in data sources presents a dilemma on which benchmark should guide the valuation methods like scorecards or checklists. The best approach is to consider a median benchmark across all sources, prioritizing specifications by industry and location or grouping startups by similarity for more precise insights.
Bottom-Up Check: Burn Rate, CAC and ARPU#
According to Aumni's 2023 Report, the median time between funding rounds stands at 24 months. This period allows to calculate the monthly burn rate in relation to the median deal size:
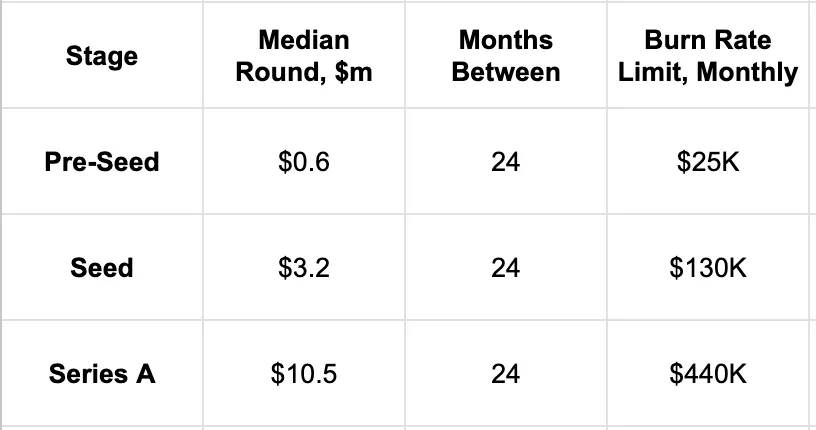
Considering the necessity to offer competitive salaries to engineers and allocate significant budgets to marketing and sales experiments, the figures seem reasonable.
The Capchase 2023 report provides further insights into the SaaS market, noting a CAC up to $30,000:
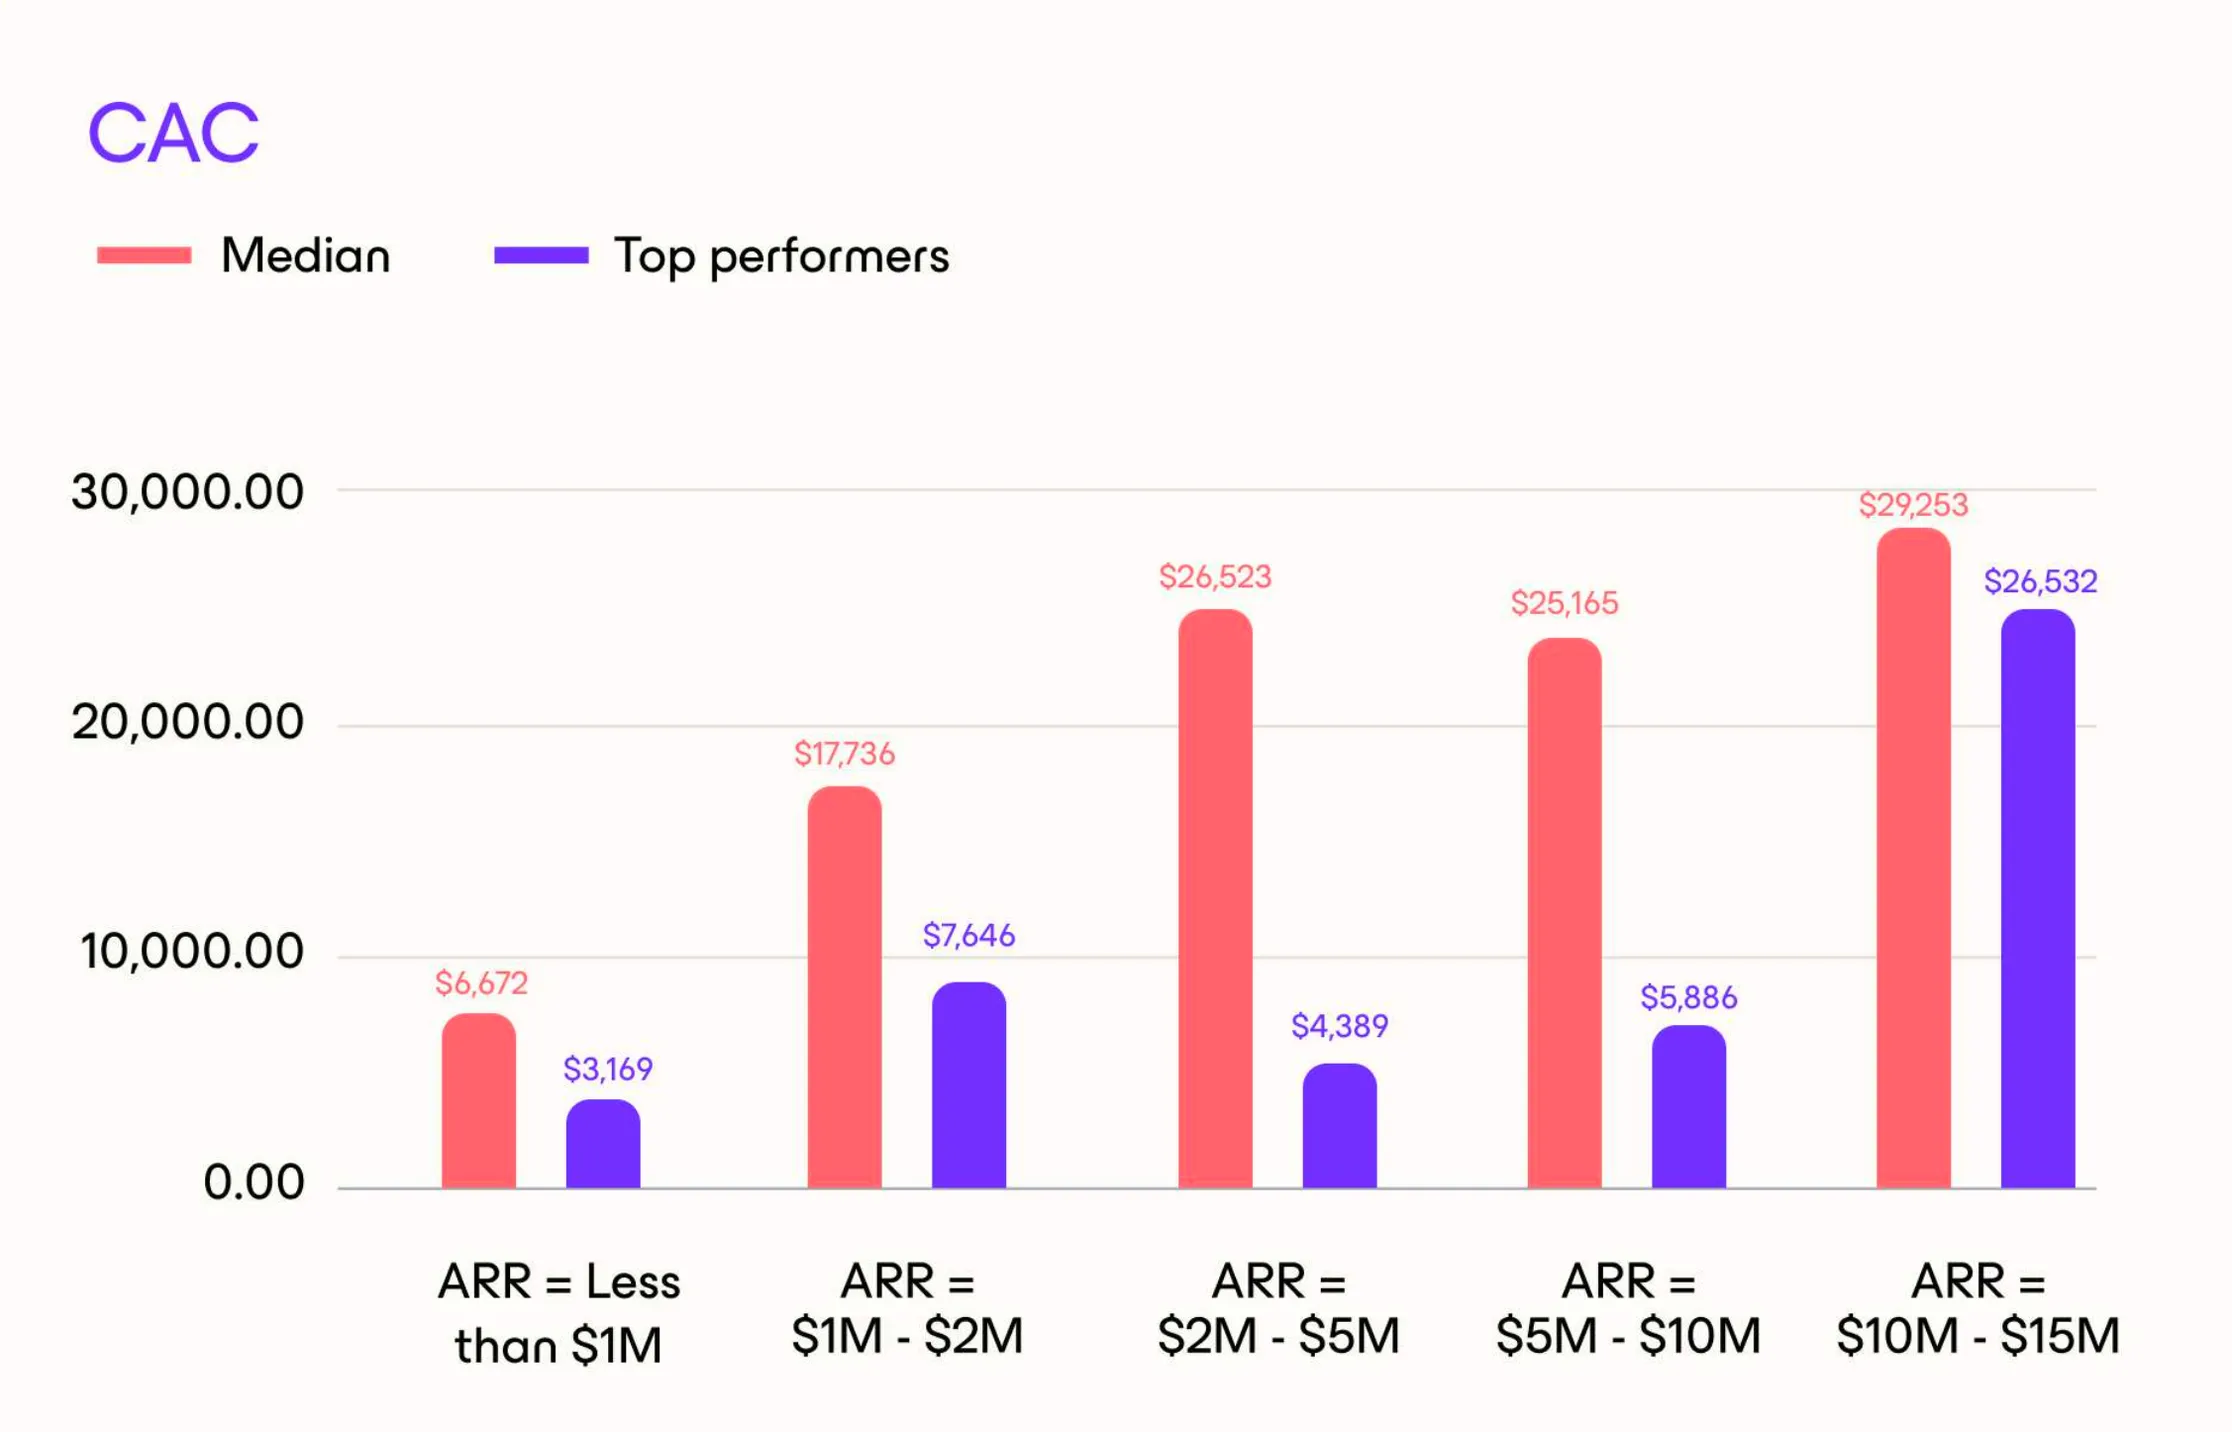
Additionally, the ARPU is reported at $2,000. To reach a seed round with a required $500K ARR, a startup would need to secure 20 customers. This effort could consume $100,000 to $600,000 of the pre-seed budget. Given a median pre-seed deal size of $600K, this challenge is significant.
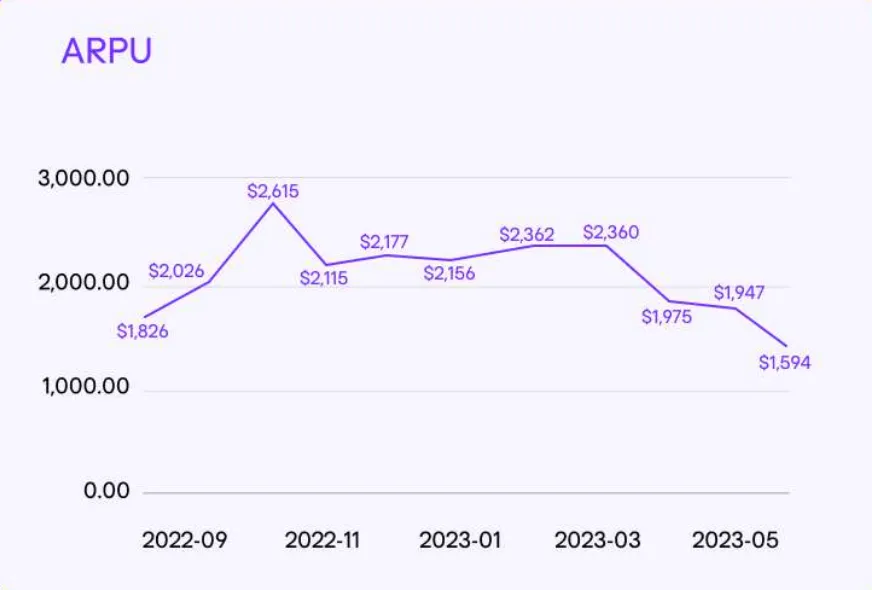
Refer to the detailed Capchase 2023 report for more insights on the SaaS market and metrics.
While the deal size appears justifiable, the standard practice of offering ~20% equity per round has been consistent for decades. This approach aims to keep founders and key team members motivated by diluting stakes gradually. Whether this norm will shift remains to be seen, but for now, it serves as a reliable standard that supports current valuations.
Exit Valuations and Required ARR#
PitchBook's 2023 data shows the median exit valuation was $111M for IPOs and $61M for M&As.
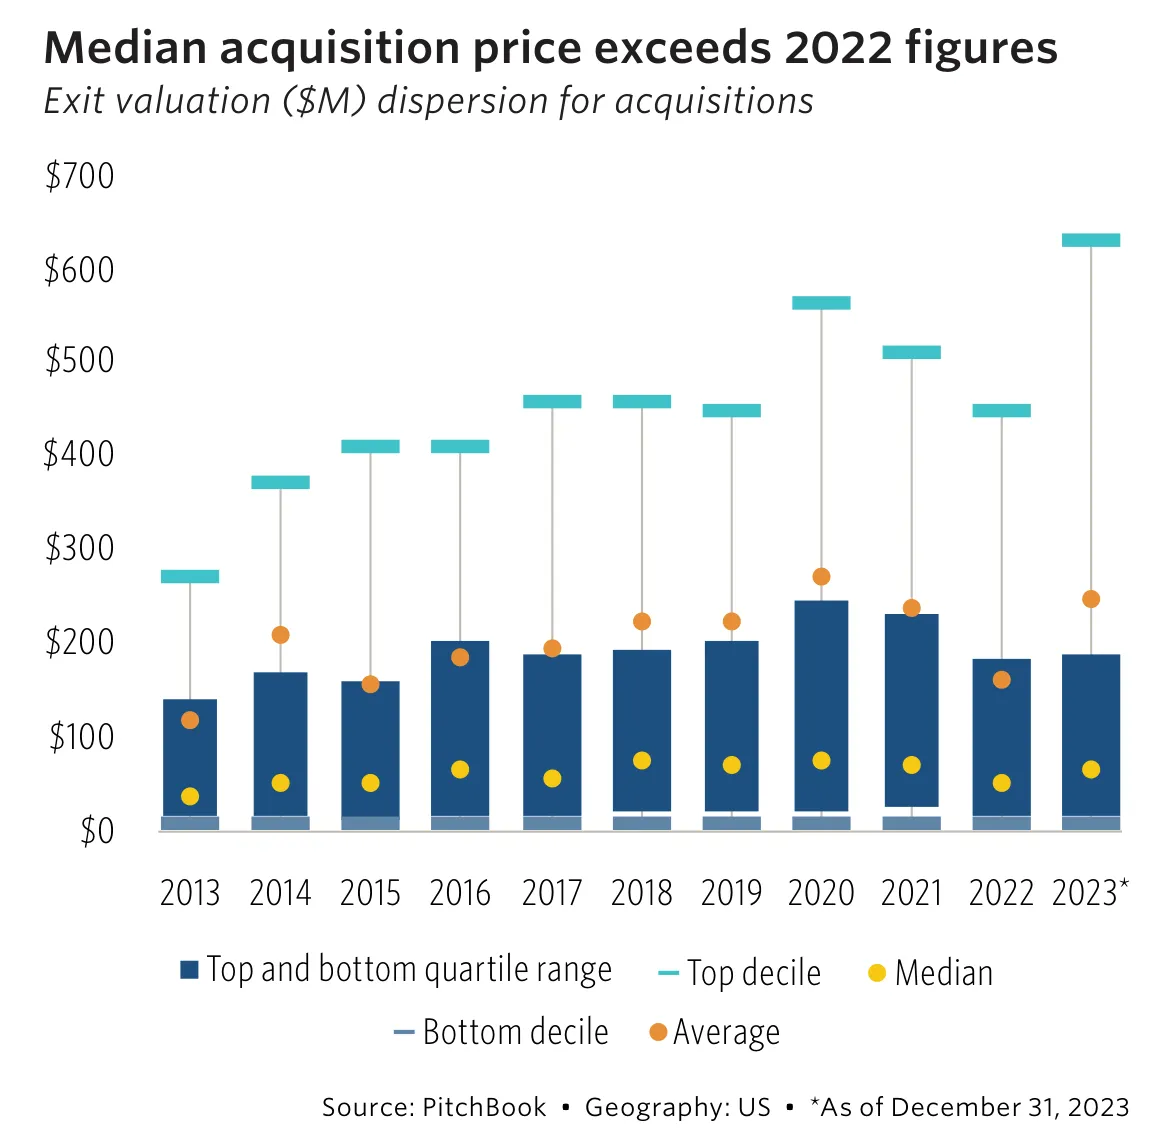
Carta adds that only 11% of startups acquired in Q2 2023 had raised over $100M.
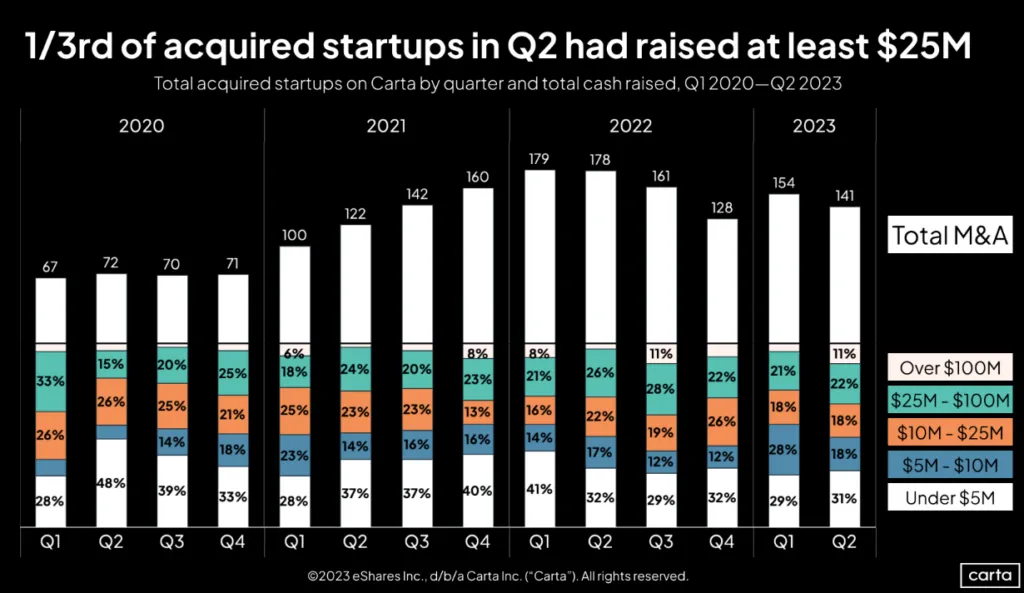
In the early stages, exits are motivated by stagnation in growth or an offer you can’t refuse, whereas in later stages, profitable IPOs or M&As are the desirable routes.
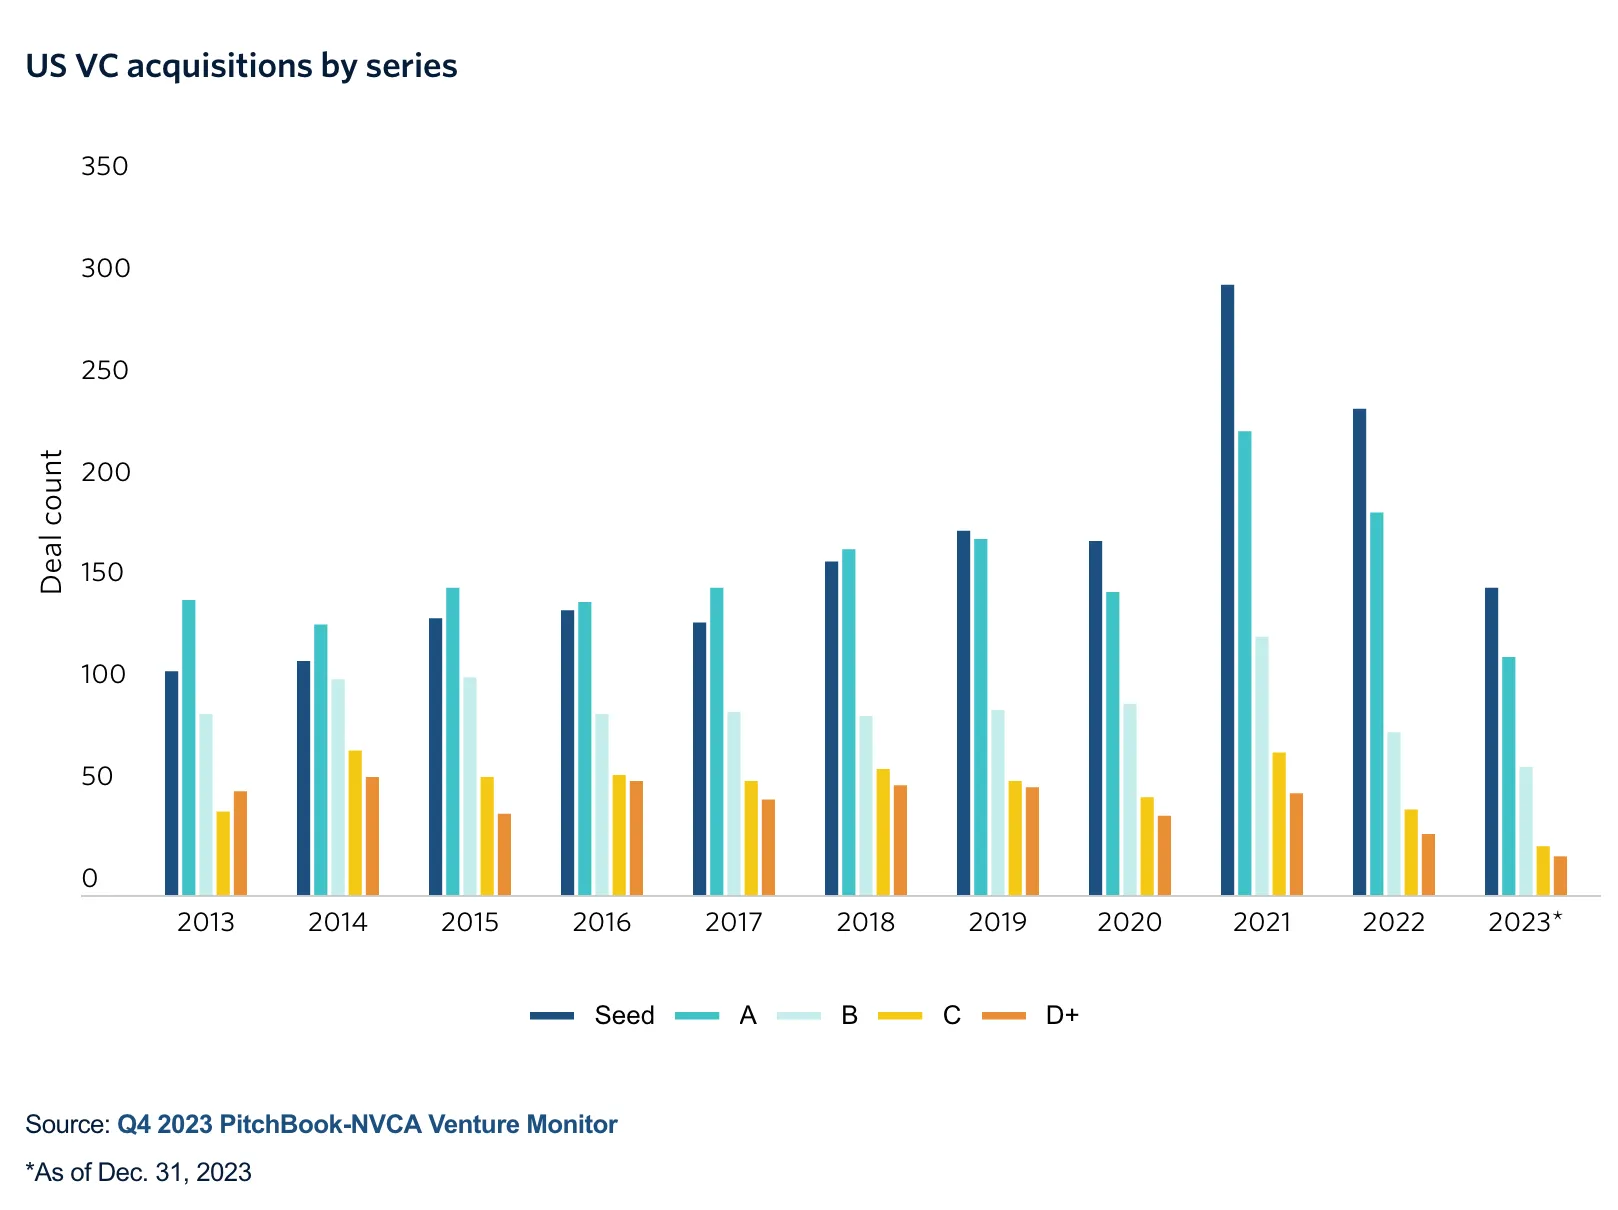
For example, consider a mid-stage Series A company with a median valuation of $44M. Achieving a $100M exit valuation, which is challenging, would yield just a 2.3x return.
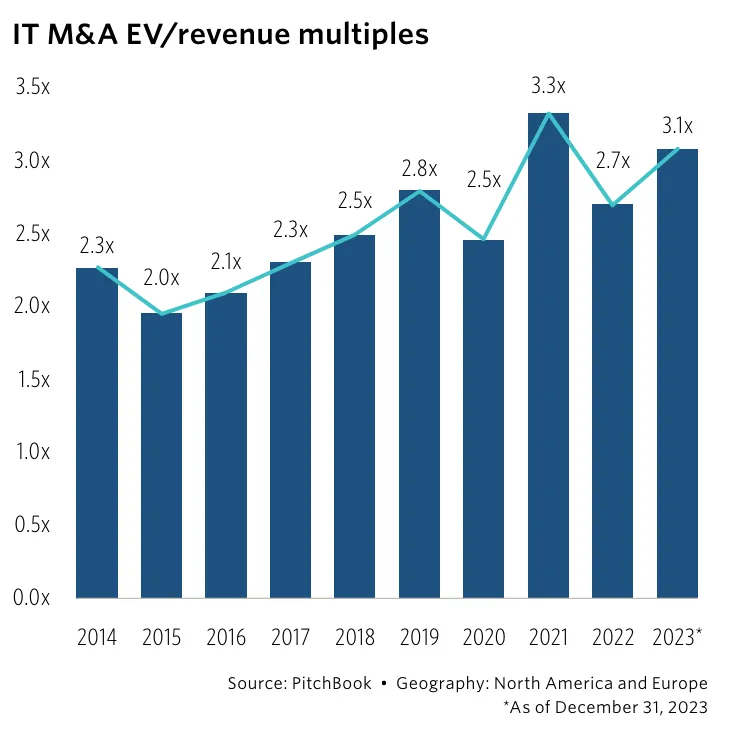
When evaluating early-stage investments, it's crucial to assess if the team, idea, and market could potentially reach or exceed a baby unicorn status. According to PitchBook, for a $500M exit, a company should ideally have $160M in ARR, reflecting a 3.1x multiple:
Let's examine the growth required for a startup to reach such revenue by the end of a 6-year period:
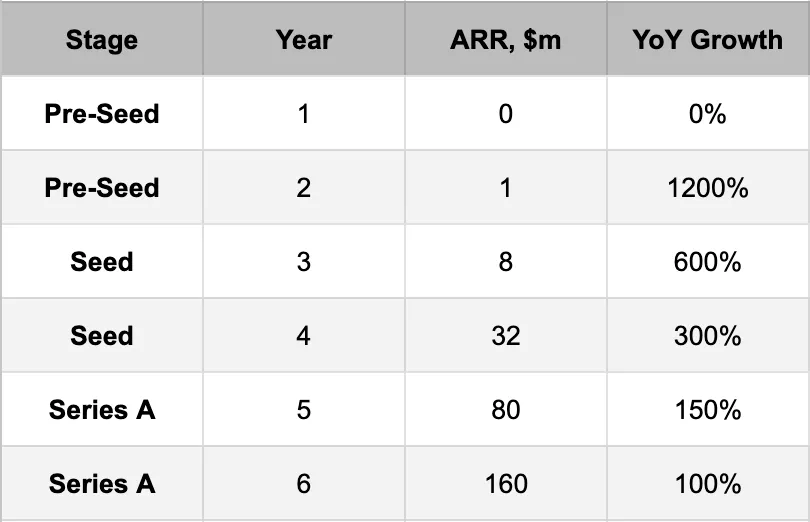
While achieving this growth is challenging, it is feasible and has been accomplished by many. Assuming a standard two-year interval between funding rounds, along with a consistent burn rate and 20% equity dilution per round, current market valuations appear reasonable for startups demonstrating rapid growth within a sizable market.
PS: All numbers are related to the US market and need to be projected onto other regions.
Previous in MondayVC Newsletter: Edition 5, Lead & Follow Investors.
Next in MondayVC Newsletter: Edition 7, VC Team Design.